Go中代码性能测试
1、传统测试
- 测试数据和测试逻辑混合在一起
- 出错信息不明确
- 一旦一个数据出错测试全部结束
2、表格驱动测试
- 分离测试数据和测试逻辑
- 明确的出错信息
- 可以部分失败
- Go 语法更容易实践表格驱动测试
这里以勾股函数为例:
triangle.go
package test_example

import (
	"fmt"
	"math"
)

func triangle() {
	var a, b int = 3, 4
	fmt.Println(calcTriangle(a, b))
}

func calcTriangle(a, b int) int {
	var c int
	c = int(math.Sqrt(float64(a*a + b*b)))
	return c
}
triangle_test.go
package test_example

import "testing"

func TestTriangle(t *testing.T) {
	// 测试数据
	tests := []struct{ a, b, c int }{
		{3, 4, 5},
		{5, 12, 13},
		{8, 15, 17},
		{12, 35, 3},    // fail:calcTriangle(12, 35) got 37; expected 3
		{30000, 40000, 50000},
	}

	// 数据和测试逻辑分离
	for _, tt := range tests {
		if actual := calcTriangle(tt.a, tt.b); actual != tt.c {
			t.Errorf("calcTriangle(%d, %d) got %d; expected %d", tt.a, tt.b, actual, tt.c)
		}
	}
}
3、代码覆盖率和性能测试
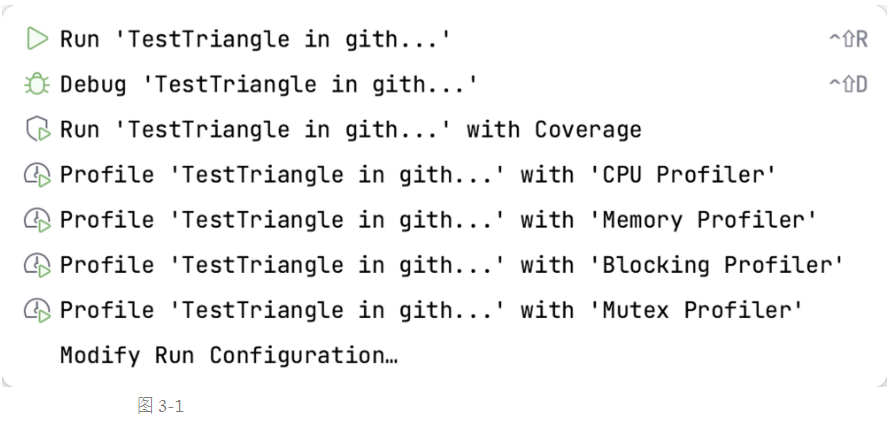
在 Goland 代码编辑器中集成了各种测试方法,如下图3-1:
命令行测试代码覆盖率
csgo/test_exmaple on main [✘!+] via 🐹 v1.19.4
❯ go test
PASS
ok github.com/shiiiiyd/csgo/test_exmaple 0.806s
代码覆盖率测试命令生成out文件
csgo/test_exmaple on main [✘!+] via 🐹 v1.19.4
❯ go test -coverprofile=c.out
PASS
coverage: 60.0% of statements
ok github.com/shiiiiyd/csgo/test_exmaple 0.817s
go tool cover 其他命令
csgo/test_exmaple on main [✘!+?] via 🐹 v1.19.4
❯ go tool cover
Usage of 'go tool cover':
Given a coverage profile produced by 'go test':
go test -coverprofile=c.out
Open a web browser displaying annotated source code:
go tool cover -html=c.out
Write out an HTML file instead of launching a web browser:
go tool cover -html=c.out -o coverage.html
Display coverage percentages to stdout for each function:
go tool cover -func=c.out
Finally, to generate modified source code with coverage annotations
(what go test -cover does):
go tool cover -mode=set -var=CoverageVariableName program.go
Flags:
-V print version and exit
-func string
output coverage profile information for each function
-html string
generate HTML representation of coverage profile
-mode string
coverage mode: set, count, atomic
-o string
file for output; default: stdout
-var string
name of coverage variable to generate (default "GoCover")
Only one of -html, -func, or -mode may be set.
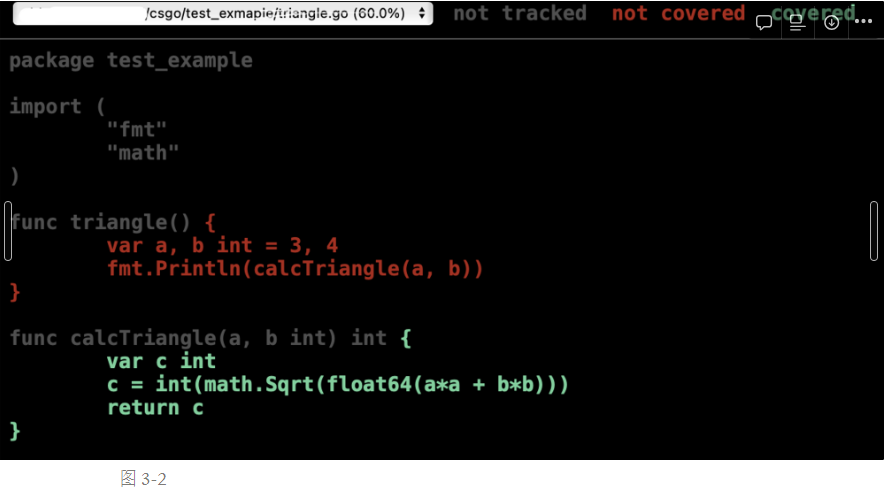
这里使用 go tool cover -html=c.out 命令查看代码覆盖率,显示为html页面,如图3-2所示:
Benchmark 性能测试,测试代码如下:
func BenchmarkTriangle(b *testing.B) {
	tests := []struct{ a, b, c int }{
		{3, 4, 5},
		{5, 12, 13},
		{8, 15, 17},
		{12, 35, 37},
		{30000, 40000, 50000},
	}
	for i := 0; i < b.N; i++ {
		for _, tt := range tests {
			actual := calcTriangle(tt.a, tt.b)
			if actual != tt.c {
				b.Errorf("calcTriangle(%d, %d) got %d; expected %d", tt.a, tt.b, actual, tt.c)
			}
		}
	}

}
测试结果:执行了285965554次,每次执行花费的时间是 4.136 纳秒
goos: darwin
goarch: arm64
pkg: github.com/shiiiiyd/csgo/test_exmaple
BenchmarkTriangle
BenchmarkTriangle-8   	285965554	         4.136 ns/op
PASS
命令行测试:
❯ go test -bench .
goos: darwin
goarch: arm64
pkg: github.com/shiiiiyd/csgo/test_exmaple
BenchmarkTriangle-8     281769649                4.144 ns/op
PASS
ok      csgo/test_exmaple   1.901s
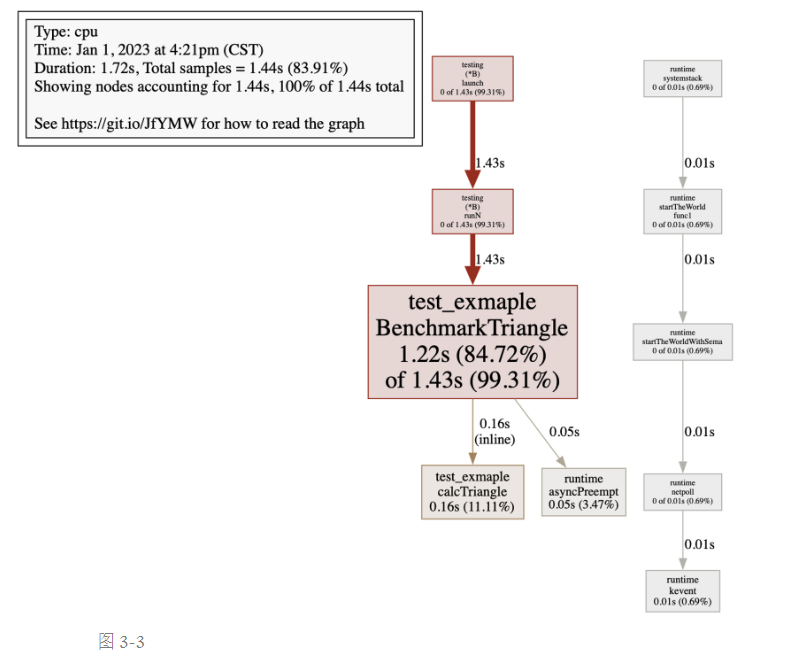
使用 go test -bench . -cpuprofile=cpu.out 命令查看,输出一个cpu.out文件,该文件是二进制文件,无法直接查看,可以使用 go tool pprof cpu.out 命令进入到交互命令界面,然后输入 web 之后就会生成一个svg文件,可以在浏览器中查看该文件的,文件内容如图3-3所示,该图生成需要提前安装 Graphviz 软件。
❯ go test -bench . -cpuprofile=cpu.out
goos: darwin
goarch: arm64
pkg: github.com/shiiiiyd/csgo/test_exmaple
BenchmarkTriangle-8     281105055                4.148 ns/op
PASS
ok      csgo/test_exmaple   2.514s

❯ go tool pprof  cpu.out
Type: cpu
Time: Jan 1, 2023 at 4:21pm (CST)
Duration: 1.72s, Total samples = 1.44s (83.91%)
Entering interactive mode (type "help" for commands, "o" for options)
(pprof) web
(pprof)